####    R Lecture 1  ####
#### Kelsey Carlston ####
# In this code, I make some objects and a data frame.

rm(list = ls())R Lecture 1: Getting Started
This page introduces the absolute basics of working in R. The goal is not to turn you into a programmer, but to give you enough familiarity to read, run, and slightly modify R code that we will use throughout the course.
Everything below is written as if it lives in an R script file (a .R file) in RStudio.
There are two ways to run code in RStudio. You can just run code directly in the console (bottom left window), but you should only do that if you never plan to run the same code again. This might be for things like basic math or looking at a dataset.
The way you should run code is in an R script. This is a text file with your code in it. By writing in an R script, you can save code and re-run it again later, which means you never lose your work!
Creating an R Script
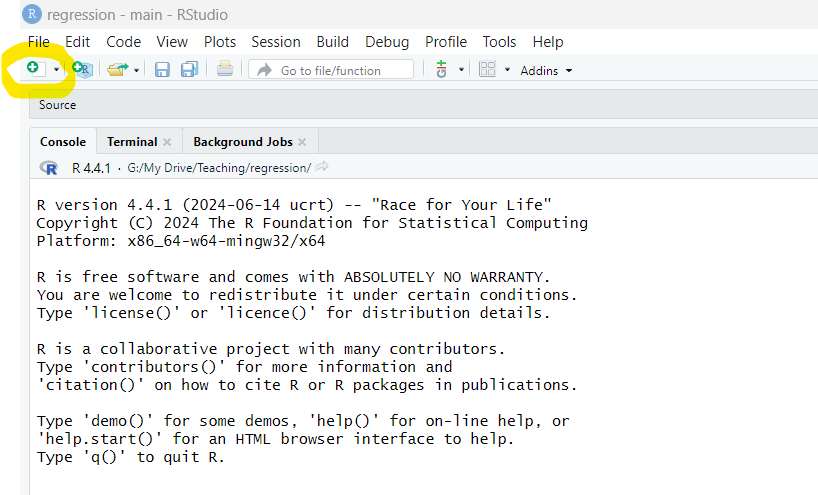
To create an R script, go to the button new file button (white page with green plus sign) and click “R Script”, or hit ctrl+shift+N (Cmd+Shift+N for Mac).
On your blank R Script, begin by typing comment with a brief header of what you are working on. Comments are indicated by #, and when they are in a line of code, the console will not try to run anything on the line after that. In your header, include a title, your name, the date, and any other information you think is important, like the goals of your script.
You also may want to include the code rm(list = ls()). This removes any objects in your environment to keep your workspace clean. In other words, it gives you a clean slate!
Running Code
To run a line of code in RStudio:
Place your cursor anywhere on the line
Press
ctrl + Enter(Windows) orCmd + Enter(Mac)
You can also highlight multiple lines and run them together.
Try writing a simple piece of code and running it.
2 + 2[1] 4When you run this line, R sends the instruction to the console and returns the result.
Making a Comment
A comment is text that R ignores. Comments are for humans, not the computer.
In R, comments begin with #. You should comment your code generously so that someone else (including future you) can understand what code is doing.
2 + 2 # This comment explains the calculation[1] 4Creating a Variable
A variable stores a value so that we can reuse it later.
We careate variables using the assignment operator <-.
x <- 5Read this as: “Store the value 5 in the object named x.”
You can view the value of a variable by typing its name in the console:
x[1] 5Using a Variable in a Calculation
Once a variable exists, you can use it in calculations.
x <- 5
y <- 2
x + y
[1] 7x * y[1] 10R automatically looks up the values stored in x and y when performing the calculation.
Creating a Data Frame
Usually we want to work with a dataset with rows (observations) and columns (variables), similar to a spreadsheet. In R, we call these data frames.
Here is a simple example of how to create a data frame:
df <- data.frame(
  hours = c(10, 12, 8, 15),
  score = c(78, 85, 72, 90)
)
This creates a data frame:
Two variables:
hoursandscoreFour observations
The data frame is stored as an object with the name df.
You can view the data frame by typing its name:
df hours score
1 10 78
2 12 85
3 8 72
4 15 90Doing a Calculation (Summary) on a Data Frame
R has built-in functions for summarizing data.
For example, you can compute summary statistics for each variable:
summary(df) hours score
Min. : 8.00 Min. :72.00
1st Qu.: 9.50 1st Qu.:76.50
Median :11.00 Median :81.50
Mean :11.25 Mean :81.25
3rd Qu.:12.75 3rd Qu.:86.25
Max. :15.00 Max. :90.00 This produces the 5 number summary plus the mean for each column.
You can also summarize a single variable:
mean(df$score)[1] 81.25To access an individual variable, you type the name of the data frame, a dollar sign, and then the variable name.
Creating a New Variable in a Data Frame
We often want to create new variables based on existing ones. Suppose we want a variable measuring score per hour studied:
df$score_per_hour <- df$score / df$hoursThis line:
Takes the existing variables
scoreandhoursPerforms a calculation row by row
Stores the result as a new column in the data frame
Accessing Parts of a Data Frame
You can access specific parts of a data frame in several ways.
Access a Column
df$score[1] 78 85 72 90This returns all of the observations for the hours variable. You can also do it through an index using brackets. When you use brackets to subset a data frame, you include two components: the row and the column. If you leave one blank, it returns everything in that dimension.
df[,2][1] 78 85 72 90This returns the second column, score.
Access a Row
Access a row using brackets.
df[3,] hours score score_per_hour
3 8 72 9This returns the third row. If you want to return multiple rows, use a colon.
df[2:4,] hours score score_per_hour
2 12 85 7.083333
3 8 72 9.000000
4 15 90 6.000000This returns the values in rows 2 through 4.
Access a Value
Put two values in the brackets to get a variable in a specific position:
df[3,2][1] 72This returns the third observation in the second column (score).
If you know which variable you want, you can access values a different way:
df$score[3][1] 72Because the variable score only has one dimension, you only put one number in the brackets. This gives us the third observation of score.
A Fully Commented Example
Below is a short script using these concepts where every line is commented.
# Create a variable storing the interest rate
sale <- 0.2

# Create a data frame called "inventory" with 4 items and their original price
inventory <- data.frame(
  item = c("Shirt", "Shoes", "Hat", "Jacket"),
  price = c(40, 80, 25, 120),
  cost = c(18, 45, 10, 70)
)

# Calculate the sale price after a 20% discount
# Formula: sale price = original price * (1-sale)
inventory$sale_price <- inventory$price * (1 - sale)

# Calculate profit per item after the discount
# Formula: profit = sale price - cost
inventory$profit <- inventory$sale_price - inventory$cost

# Display profit
inventory$profit
[1] 14 19 10 26Exercise
Below is a short R script. Your task is to add a comment explaining what each line does.
income <- c(40000, 52000, 61000, 45000)
education <- c(12, 16, 16, 14)
df <- data.frame(income, education)
df$income_thousands <- df$income / 1000
mean(df$income_thousands)
[1] 49.5Your comments should be written so that someone with no prior R experience could understand what the code is doing at each step.
Answer
The comments for each line of the previous code might be:
Create a vector with income data
Create a vector with education data
Create a data frame with income and education
Create a variable in the data frame for income in thousands
Calculate the mean of income in thousands